Bar Chart#
Description:
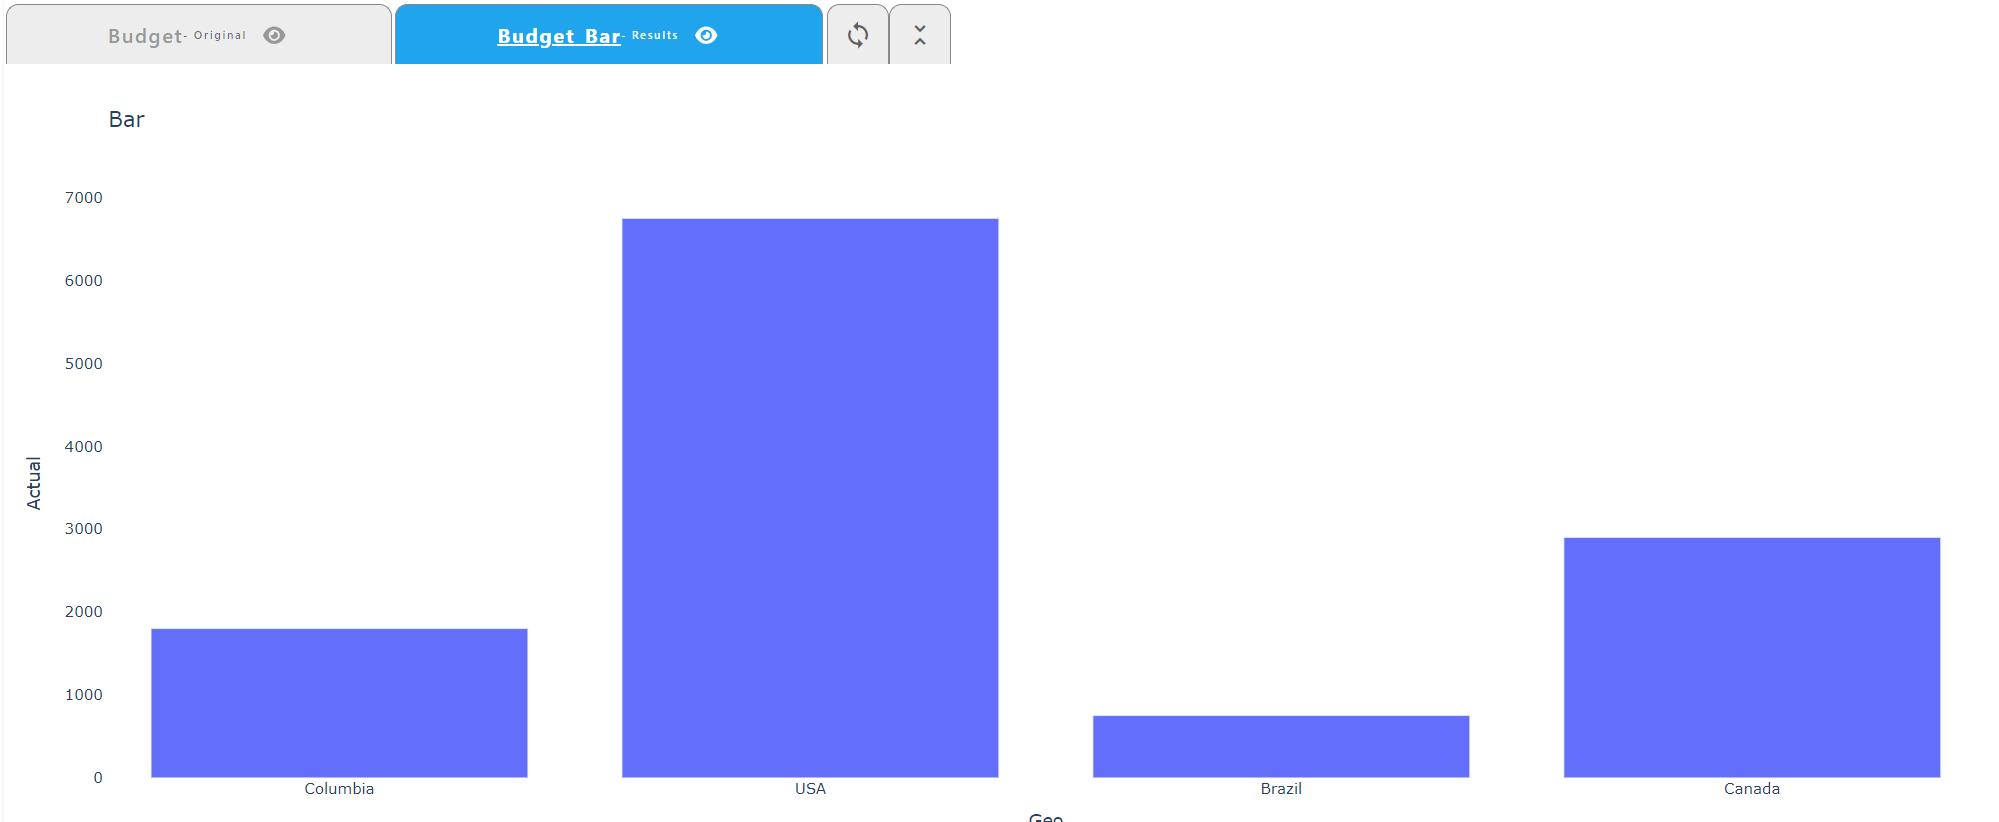
A Bar Chart visual based on the given inputs. It will generate a new tab displaying the chart.
Function:
Bar_Chart(table = string, x_axis = string, y_axis = string, title = string)
Parameters:
Table: Table name on which to perform the function
X Axis: Column to use for the X axis of the chart
Y Axis: Column to use for the Y axis of the chart
Title: Title for the chart
Example:
Bar_Chart(table = Budget, x_axis = "Geo", y_axis = "Actual", title = "Bar")
Date |
Geo |
Plan |
Actual |
|---|---|---|---|
8/22/2023 |
Canada |
1200 |
900 |
9/1/2022 |
Columbia |
1150 |
1000 |
8/31/2022 |
Columbia |
2000 |
1800 |
2/13/2023 |
USA |
1850 |
2000 |
2/15/2024 |
Canada |
900 |
900 |
7/16/2024 |
Canada |
1050 |
1100 |
10/8/2024 |
USA |
1500 |
1300 |
6/10/2024 |
USA |
1700 |
1400 |
9/3/2024 |
Brazil |
800 |
750 |
8/2/2024 |
USA |
950 |
1050 |