Pie Chart#
Description:
A Pie Chart visual based on the given inputs. It will generate a new tab displaying the chart.
Function:
Pie_Chart(table = string, values = string, legend = string, title = string)
Parameters:
Table: Table name on which to perform the function
Values: Column to use for the values of the chart
Legend: Column to use for the legend of the chart
Title: Title for the chart
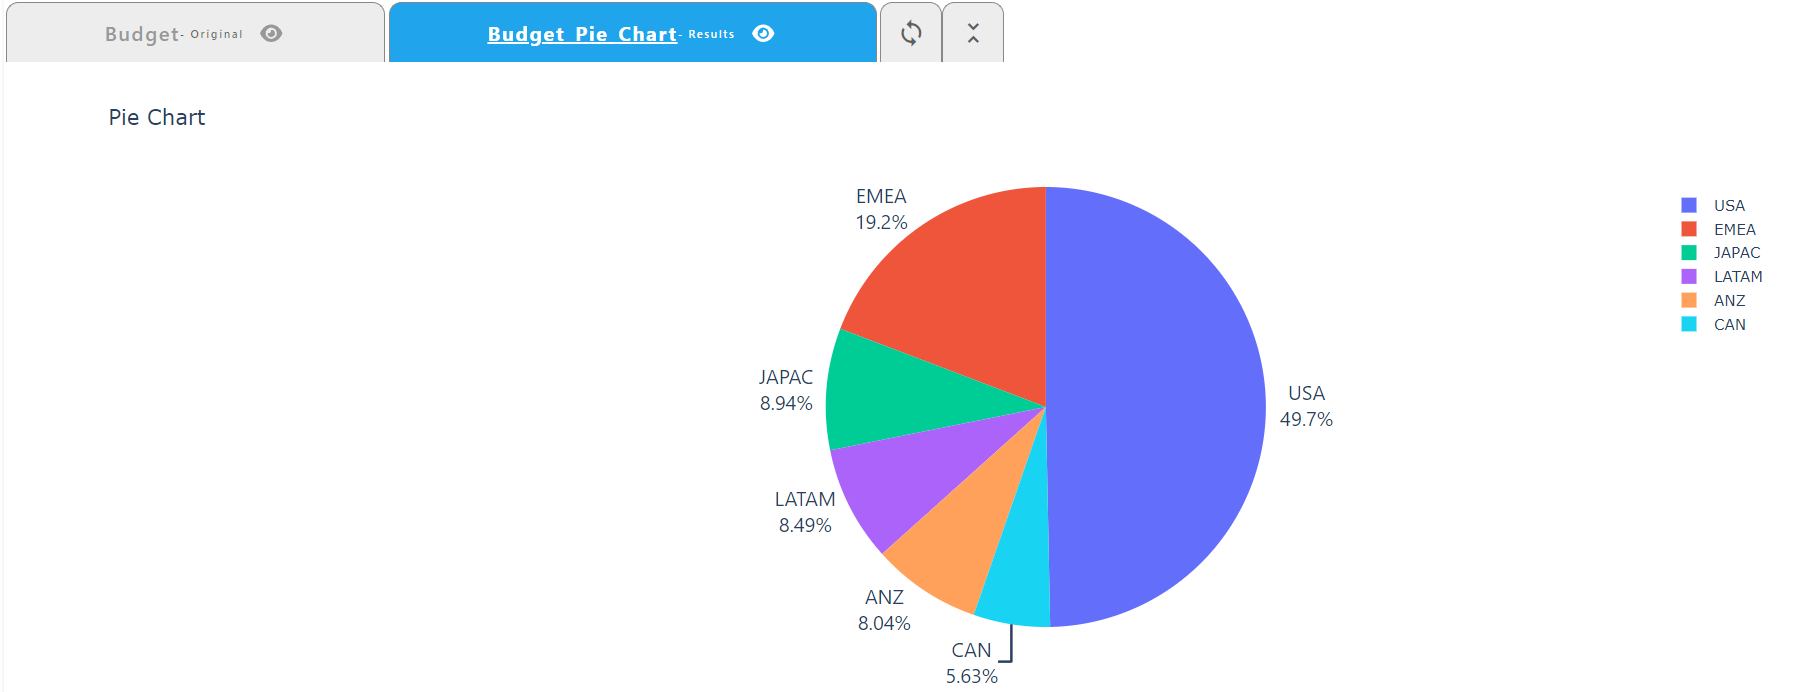
Example:
Pie_Chart(table = Budget, values = "Revenue", legend = "Geo", title = "Pie Chart")
Geo |
Revenue |
|---|---|
USA |
5560 |
CAN |
630 |
LATAM |
950 |
JAPAC |
1000 |
ANZ |
900 |
EMEA |
2150 |